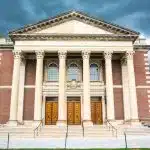

Northwestern admitted an estimated 3,780 students out of roughly 54,000 applicants for the Class of 2030, yielding an approximate 7% acceptance rate. For Early Decision (ED), Northwestern received more than 5,600 ED applications and had an estimated ED acceptance rate of 18.75%.
In this blog, you’ll find a closer look at Northwestern’s overall, early, regular, waitlist, and transfer acceptance rates across every available year and what the trends reveal about the school’s evolving selectivity.
- Northwestern Acceptance Rates
- Northwestern Early Decisions Acceptance Rate
- Northwestern Regular Decision Acceptance Rate
- Northwestern Transfer Acceptance Rate
- Northwestern Waitlist Acceptance Rate
- Frequently Asked Questions
- Takeaways
Northwestern Acceptance Rates
Northwestern’s overall acceptance rate for the Class of 2030 is an estimated 7%, slightly lower than the 7.4% recorded for the Class of 2029. Applications rose from 53,321 to more than 54,000, while the admit count is calculated at approximately 3,780, derived from Northwestern’s officially released figures.
Northwestern’s acceptance rate has trended generally downward over the past several years, falling from over 9% to the mid-7% range, with a few minor fluctuations. Here’s the complete picture:
| Class | Applicants | Admitted | Overall Acceptance Rate |
| 2030 | ~54,000 | ~3,780 | 7% |
| 2029 | 53,321 | ~3,946 | 7.4% |
| 2028 | 49,474 | 3,806 | 7.69% |
| 2027 | 51,769 | 3,739 | 7.22% |
| 2026 | 51,261 | 3,695 | 7.21% |
| 2025 | 47,636 | 3,321 | 6.97% |
| 2024 | 39,263 | 3,654 | 9.31% |
| 2023 | 40,585 | 3,673 | 9.05% |
| 2022 | 40,425 | 3,422 | 8.47% |
| 2021 | 37,259 | 3,442 | 9.24% |
Note: The Class of 2029 and 2030 overall acceptance rate is a rough estimate provided by Northwestern’s official website. The data from the Class of 2021 to 2028 has been compiled from Northwestern’s Common Data Set.
Applications grew from 37,259 for the Class of 2021 to a new peak of approximately 54,000 for the Class of 2030, a surge of over 44%. Test-optional policies during and after the COVID-19 pandemic drove much of the early growth, while the brief dip to 49,474 for the Class of 2028 likely reflected uncertainty following the 2023 Supreme Court ruling ending race-conscious admissions. The rebound to a new peak for the Class of 2030 suggests that hesitation was short-lived.
The number of admitted students has remained constrained, ranging from roughly 3,300 to 3,800 across all years. That combination drove the acceptance rate down from 9.24% for the Class of 2021 to a record low of approximately 7% for the Classes of 2025 through 2030, with minor fluctuations within that range.
Northwestern Early Decisions Acceptance Rate
The most recent ED figures we have are estimates for the Class of 2030, based on partial data Northwestern has released. The school has disclosed over 5,600 ED applicants for the Class of 2030, with more than half of the class admitted, putting the estimated acceptance rate at roughly 18.75% (around 1,050 admitted). For comparison, the Class of 2029 is estimated at around 6,000 applicants, with about 1,200 admitted for an estimated rate of 20.00%.
Full confirmed data is not yet available for either class. The most recent fully confirmed figures come from the Class of 2028: 5,154 early applications and 1,186 admitted, for a rate of 23.01%, up slightly from 22.55% for the Class of 2027.
Northwestern Early Decision acceptance rate trends
Northwestern’s ED acceptance rates have declined over the past decade, dropping from roughly 27% to around 22-23%. Here’s a breakdown:
| Class | Applicants | Admitted | Early Acceptance Rate |
| 2030 | ~5,600 | ~1,050 | ~18.75% |
| 2029 | ~6,000 | ~1,200 | ~20.00% |
| 2028 | 5,154 | 1,186 | 23.01% |
| 2027 | 5,207 | 1,174 | 22.55% |
| 2026 | 5,021 | 1,109 | 22.09% |
| 2025 | 4,545 | 1,105 | 24.31% |
| 2024 | 4,411 | 1,105 | 25.05% |
| 2023 | 4,399 | 1,096 | 24.91% |
| 2022 | 4,057 | 1,077 | 26.55% |
| 2021 | 3,830 | 1,030 | 26.89% |
Note: All data, except for the Class of 2029 and 2030, has been sourced from Northwestern’s Common Data Set.
ED applications grew steadily from 3,830 for the Class of 2021 to a peak of 5,207 for the Class of 2027, before dipping slightly to 5,154 for the Class of 2028. For the Class of 2029, the estimated pool climbed further to roughly 6,000 applicants, the largest in this dataset, with about 1,200 admitted. The Class of 2030 pool is estimated at over 5,600 applicants, with roughly 1,050 admitted, pushing the acceptance rate down to an estimated 18.75%.
Admitted class size has risen slightly overall, from 1,030 for the Class of 2021 to a high of 1,186 for the Class of 2028, while applicant growth has outpaced admit growth, driving the acceptance rate from a high of 26.89% for the Class of 2021 to an estimated 18.75% for the Class of 2030, the lowest point in the ten-year span.
Northwestern Regular Decision Acceptance Rate
The most recent RD figures we have are estimates for the Class of 2030, based on partial data Northwestern has released. Applications are estimated at roughly 48,400 with about 2,730 admitted, putting the acceptance rate at approximately 5.64%. For comparison, the Class of 2029 is estimated at roughly 47,321 applicants with about 2,746 admitted, for an estimated rate of 5.80%.
Full confirmed data is not yet available for either class. The latest confirmed RD figures come from the Class of 2028: 44,320 applied and 2,620 were admitted, for a rate of 5.91%, up from 5.51% for the Class of 2027. RD applicants have historically had lower acceptance rates than ED applicants.
Northwestern Regular Decision acceptance rate trends
Northwestern’s RD acceptance rates have stayed in a narrow range over the past decade, generally falling between 5% and a little over 7%. Here is how the numbers have changed over time:
| Class | Applicants | Admitted | Regular Acceptance Rate |
| 2030 | ~48,400 | ~2,730 | ~5.64% |
| 2029 | ~47,321 | ~2,746 | ~5.80% |
| 2028 | 44,320 | 2,620 | 5.91% |
| 2027 | 46,562 | 2,565 | 5.51% |
| 2026 | 46,240 | 2,586 | 5.59% |
| 2025 | 43,091 | 2,216 | 5.14% |
| 2024 | 34,852 | 2,549 | 7.31% |
| 2023 | 36,186 | 2,577 | 7.12% |
| 2022 | 36,368 | 2,345 | 6.45% |
| 2021 | 33,429 | 2,412 | 7.22% |
Note: RD figures are estimates calculated by subtracting ED data from Northwestern’s overall admission totals, as reported in their Common Data Set.
RD applications grew from 33,429 for the Class of 2021 to a peak of 46,562 for the Class of 2027, then dipped to 44,320 for the Class of 2028 before climbing further to an estimated 47,321 for the Class of 2029 and 48,400 for the Class of 2030, the largest pool in this dataset. The number of students admitted has stayed relatively steady, ranging from 2,216 to 2,620 across the confirmed classes, with the Class of 2029 at roughly 2,746 and the Class of 2030 at roughly 2,730.
As more students applied without a proportional increase in spots, the acceptance rate fell from a high of 7.31% for the Class of 2024 to a low of 5.14% for the Class of 2025, and has remained below 6% since, with the Class of 2029 and 2030 estimates at 5.80% and 5.64% continuing that pattern.
Northwestern Transfer Acceptance Rate
The most recent available Northwestern transfer data comes from Fall 2024, with an acceptance rate of 11.97%. Here’s the breakdown:
| Applicants | Admitted | Transfer Acceptance Rate |
| 4,045 | 484 | 11.97% |
Note: Fall 2024 transfer data is from Northwestern’s Common Data Set for 2024-2025, the same reporting year that includes Class of 2028 first-year admissions data.
Northwestern’s transfer process is notably more accessible than its first-year admissions. The 11.97% transfer acceptance rate is roughly double the 5.91% RD acceptance rate for the Class of 2028, suggesting that transfer applicants have a somewhat better chance of admission than first-year RD applicants.
Northwestern Waitlist Acceptance Rate
The most recent available Northwestern waitlist data comes from the Class of 2028, which admitted 59 students. Here’s the breakdown:
| Waitlisted | Confirmed | Admitted | Waitlist Acceptance Rate |
| N/A | N/A | 59 | N/A |
Note: Class of 2028 waitlist data is from Northwestern’s Common Data Set for 2024-2025, the same reporting year that includes Class of 2028 first-year admissions data.
Northwestern only shares how many students were admitted from the waitlist each year, so an acceptance rate cannot be calculated. The last full numbers available were for the Class of 2023, when 3,067 students were waitlisted, 1,482 chose to stay on it, and only 55 were eventually admitted. The 59 students admitted from the Class of 2028 waitlist point to a similar outcome.
Getting off Northwestern’s waitlist comes down to timing and enrollment needs, both of which are out of your control. If you find yourself on the waitlist, read our Northwestern waitlist guide for the strategic steps you can take to give yourself the best possible shot.
Frequently Asked Questions
1. What is Northwestern’s current acceptance rate?
The most recent estimate is approximately 7% for the Class of 2030, when Northwestern admitted an estimated 3,780 students out of roughly 54,000 total applicants.
2. Is it easier to get into Northwestern through Early Decision or Regular Decision?
Early Decision. For the Class of 2030, the estimated ED rate was 18.75% compared to an estimated 5.64% for RD, more than three times higher. The gap has held steady across recent classes, with the Class of 2028 showing a confirmed ED rate of 23.01% against 5.91% for RD. That said, ED applicants tend to be among the most committed and competitive in the pool.
3. How hard is it to transfer to Northwestern?
Difficult, but more accessible than first-year admissions. For Fall 2024, 484 out of 4,045 applicants were admitted for an 11.97% transfer rate, roughly double the first-year RD rate for the Class of 2028.
4. What are my chances of getting off Northwestern’s waitlist?
It depends on the year and Northwestern’s enrollment needs. Northwestern does not disclose full waitlist figures, but 59 students were admitted from the waitlist for the Class of 2028, similar to the 55 admitted for the Class of 2023.
5. Why is Northwestern’s acceptance rate so low?
Application volume has grown significantly over the past decade, climbing from around 37,000 for the Class of 2021 to nearly 50,000 for the Class of 2028, while class size has remained relatively stable.
Takeaways
- Northwestern’s acceptance rate has declined steadily, from 9.24% for the Class of 2021 to a record low of around 7% for the Classes of 2025 through 2030, as application volume has grown faster than available spots.
- ED offers a significant statistical advantage. For the Class of 2030, the estimated ED rate was 18.75% compared to an estimated 5.64% for RD, more than three times higher, though ED applicants also tend to be among the strongest and most committed candidates.
- Estimates put the ED pool at over 5,600 applicants with roughly 1,050 admitted for the Class of 2030 (18.75%), and around 6,000 applicants with about 1,200 admitted for the Class of 2029 (20%).
- Transfer and waitlist outcomes are limited and unpredictable, with a 11.97% transfer rate for Fall 2024 and waitlist admits hovering around 55 to 59 in recent years with no full figures disclosed.
- With acceptance rates this low, working with a college admissions expert can make a meaningful difference in how you approach the process, build your profile, and put together the strongest application possible.