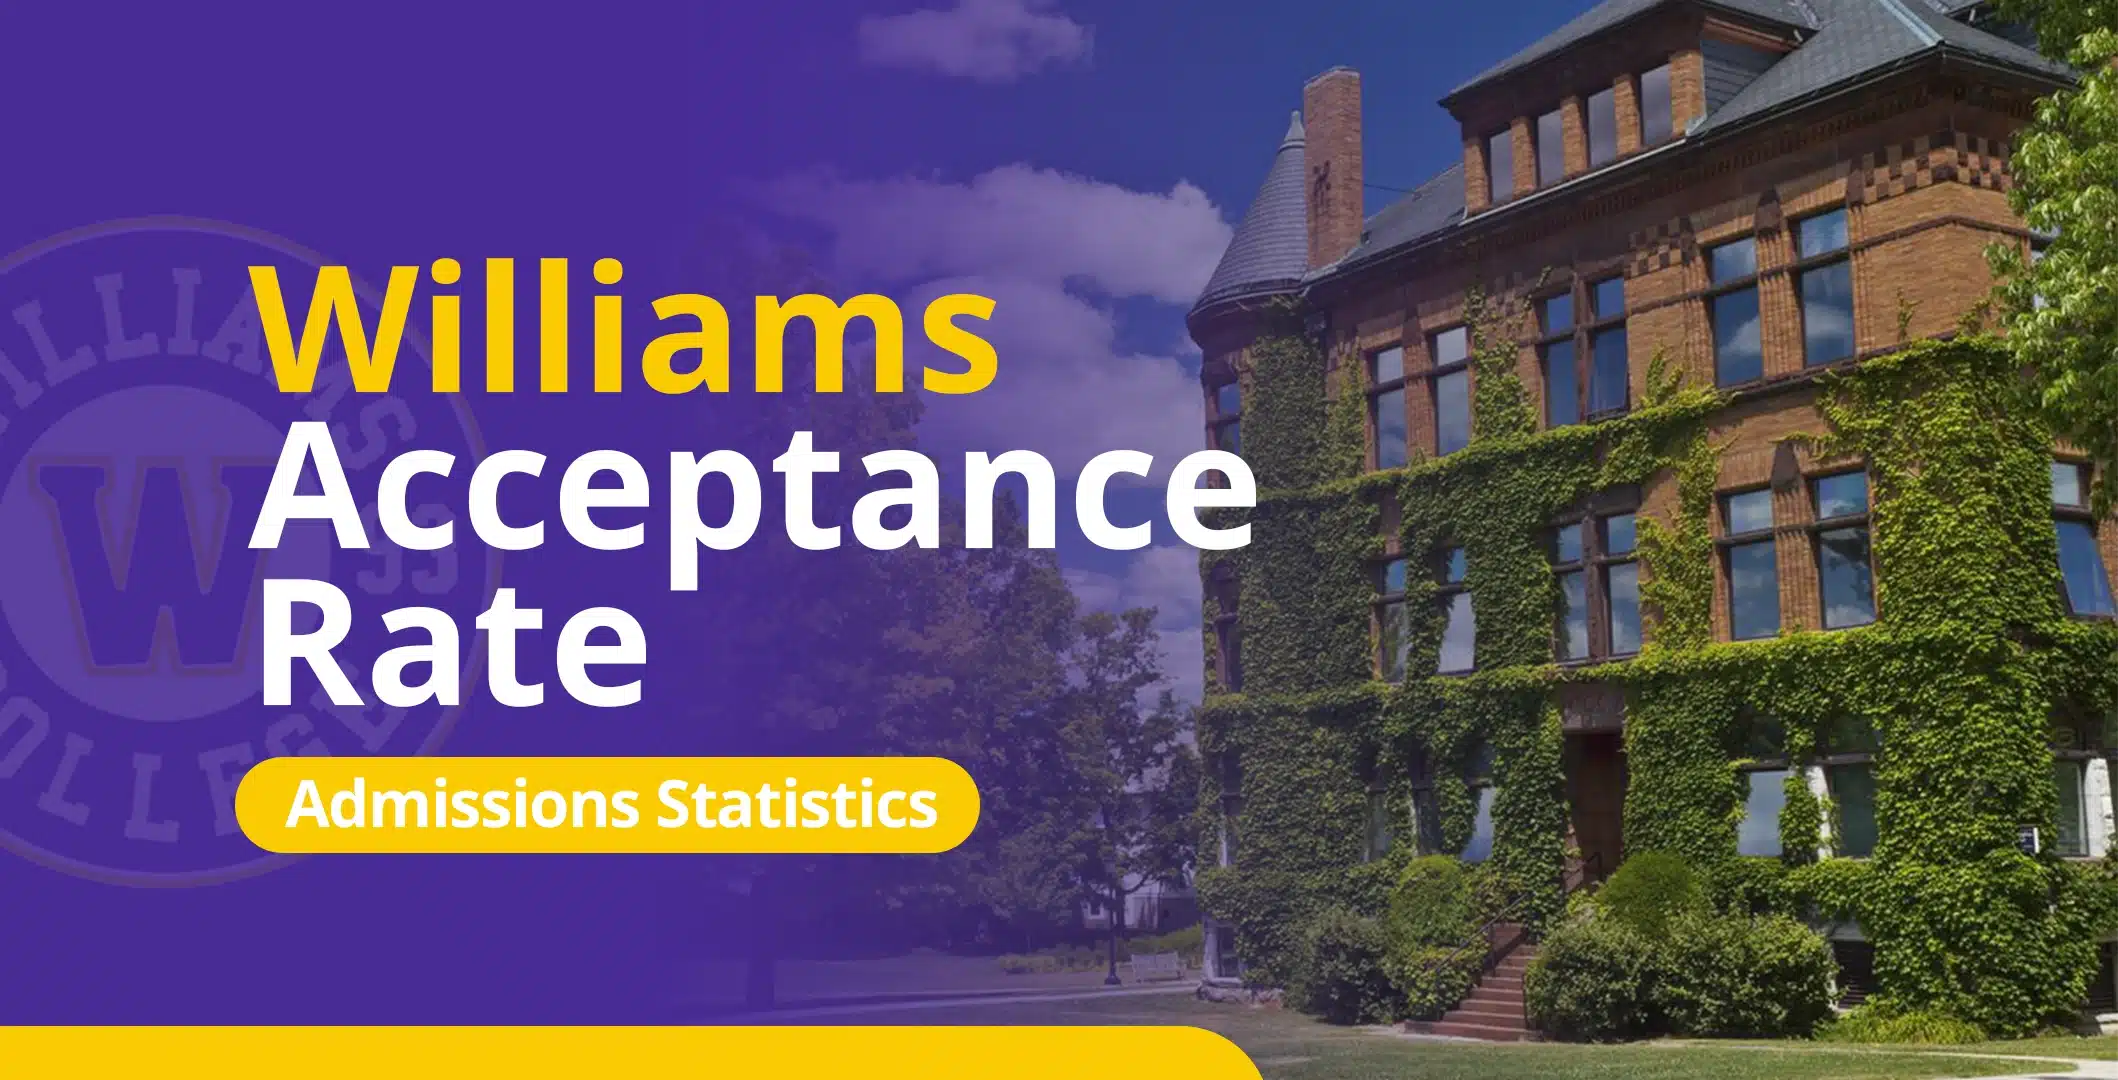
Williams admitted 1,239 students out of 16,557 applicants for the Class of 2030 for a 7.48% acceptance rate, one of the lowest in the college’s history. To put that in perspective, roughly 9 out of every 10 students who applied didn’t get in.
ED decisions came out in December 2025, where Williams accepted 25.22% of early applicants. RD results followed in April 2026, with 981 students admitted from 15,534 applicants for a 6.32% acceptance rate, a new record low for the regular decision round.
In this blog, we’ll walk through Williams’ latest available overall, early, regular, waitlist, and transfer acceptance rates and see how they’ve changed over time.
- Williams Acceptance Rates
- Williams Early Action Acceptance Rate
- Williams Regular Decision Acceptance Rate
- Williams Transfer Acceptance Rate
- Williams Waitlist Acceptance Rate
- Frequently Asked Questions
- Takeaways
Williams Acceptance Rates
Williams’s overall acceptance rate for the Class of 2030 fell to 7.48%, a notable decline from the 8.61% recorded for the Class of 2029. This shift was driven by a surge in applications, from 15,520 to a new all-time high of 16,557, while the number of admitted students dipped to 1,239.
Williams’s overall acceptance rate has declined considerably over the past decade, falling from above 14% to single digits in recent years. Here’s the complete picture:
|
Williams Class |
Applicants | Admitted |
Overall Acceptance Rate |
|
2030 |
16,557 | 1,239 | 7.48% |
| 2029 | 15,520 | 1,336 |
8.61% |
| 15,411 | 1,272 | 8.25% | |
| 2027 | 11,465 | 1,145 |
9.99% |
| 15,321 | 1,302 | 8.50% | |
| 2025 | 12,452 | 1,099 |
8.83% |
| 8,745 | 1,322 | 15.12% | |
| 2023 | 9,715 | 1,224 |
12.60% |
| 9,560 | 1,240 | 12.97% | |
| 2021 | 8,593 | 1,253 |
14.58% |
Note: All data has been compiled from Williams’ Common Data Set.
Applications nearly doubled from 8,593 for the Class of 2021 to a new peak of 16,557 for the Class of 2030, a surge likely fueled by test-optional policies and growing interest in elite liberal arts colleges.
Meanwhile, the number of admitted students has remained relatively stable, ranging from 1,099 to 1,336 across all years. That combination of surging applications and a fixed admit pool drove the acceptance rate from 14.58% for the Class of 2021 down to 7.48% for the Class of 2030, a near-halving in just nine years.
Williams Early Decision Acceptance Rates
The most recent ED figures come from the Class of 2030, when Williams received 1,023 early applications and admitted 258 students for an acceptance rate of 25.22%, up from 23.34% for the Class of 2028 but down from 26.56% for the Class of 2029.
Williams Early Decision acceptance rate trends
Williams’s ED acceptance rates have fallen sharply over the past decade, dropping from above 35% to the mid-20s. Here’s a breakdown:
|
Williams Class |
Applicants | Admitted |
Early Acceptance Rate |
|
2030 |
1,023 | 258 | 25.22% |
| 2029 | 964 | 256 |
26.56% |
|
2028 |
1,067 | 249 | 23.34% |
| 2027 | 943 | 255 |
27.04% |
|
2026 |
814 | 254 | 31.20% |
| 2025 | 715 | 238 |
33.29% |
|
2024 |
634 | 249 | 39.27% |
| 2023 | 689 | 257 |
37.30% |
|
2022 |
748 | 258 | 34.49% |
| 2021 | 728 | 257 |
35.30% |
Note: All data has been sourced from Williams’s Common Data Set.
ED applications grew steadily from 634 for the Class of 2024 to a peak of 1,067 for the Class of 2028, dipped for the Class of 2029, then bounced back to 1,023 for the Class of 2030.
Admits have remained remarkably consistent, ranging narrowly from 238 to 258 across all years. That combination of rising applications and a fixed admit pool pushed the ED acceptance rate from a high of 39.27% for the Class of 2024 down to a low of 23.34% for the Class of 2028, before recovering modestly to 25.22% for the Class of 2030.
Even so, early applicants have continued to see considerably stronger odds than their regular decision counterparts.
Williams Regular Decision Acceptance Rate
The most recent RD data comes from the Class of 2030, where 15,534 students competed for 981 spots, resulting in a 6.32% acceptance rate, down from 7.42% for the Class of 2029 and a record low in Williams’s history.
Williams Regular Decision acceptance rate trends
Over the past decade, Williams’s RD acceptance rate has been cut nearly in half, falling from above 12% to the low single digits. Here’s a full breakdown:
|
Williams Class |
Applicants | Admitted |
Regular Acceptance Rate |
|
2030 |
15,534 | 981 | 6.32% |
| 2029 | 14,556 | 1,080 |
7.42% |
|
2028 |
14,344 | 1,023 | 7.13% |
| 2027 | 10,522 | 890 |
8.46% |
|
2026 |
14,507 | 1,048 | 7.22% |
| 2025 | 11,737 | 861 |
7.34% |
|
2024 |
8,111 | 1,073 | 13.23% |
| 2023 | 9,026 | 967 |
10.71% |
|
2022 |
8,812 | 982 | 11.14% |
| 2021 | 7,865 | 996 |
12.66% |
Note: RD figures are estimates derived by subtracting ED data from overall totals in Williams’s Common Data Set.
The number of RD applicants nearly doubled from 7,865 for the Class of 2021 to a new record of 15,534 for the Class of 2030. But the number of students admitted comparatively didn’t change much, staying between 861 and 1,080 each year. More applicants competing for roughly the same number of spots pushed the acceptance rate down from 13.23% for the Class of 2024 to a record low of 6.32% for the Class of 2030.
Williams Transfer Acceptance Rate
The most recent available Williams transfer data comes from Fall 2025, with an acceptance rate of 3.87%. Here’s the breakdown:
|
Applicants |
Admitted | Transfer Acceptance Rate |
| 595 | 23 |
3.87% |
Note: Fall 2025 transfer data is from Williams’s Common Data Set for 2025-2026, the same reporting year that includes Class of 2030 first-year admissions data.
Williams’s transfer process is extremely selective. The 3.87% transfer rate for Fall 2025 is above the 2.76% recorded for Fall 2024 but remains well below the 7.48% overall first-year rate for the Class of 2030.
Williams Waitlist Acceptance Rate
The most recent waitlist data comes from the Class of 2029, when Williams admitted just 2.94% of students who confirmed their spots on the waitlist. Here’s the breakdown:
|
Waitlisted |
Confirmed | Admitted | Waitlist Acceptance Rate |
| 2,193 | 850 | 25 |
2.94% |
Note: Waitlist data is from Williams’s Common Data Set for 2025-2026.
Williams’s most recent waitlist acceptance rate of 2.94% is a sharp drop from the 13.17% recorded the prior year, illustrating just how much this figure can swing based on enrollment needs. With only 25 students admitted from 850 who confirmed their waitlist spot, odds were extremely slim.
Frequently Asked Questions
1. What is Williams’s current acceptance rate?
The most recent acceptance rate is 7.48% for the Class of 2030. Williams received 16,557 applications and admitted 1,239 students.
2. Is it easier to get into Williams through Early Decision or Regular Decision?
ED applicants have consistently fared better. For the Class of 2030, the ED rate was 25.22% compared to 6.32% for RD, nearly four times higher. That said, ED applicants also tend to be among the most competitive in the pool.
3. How hard is it to transfer to Williams?
Very difficult. For Fall 2025, only 23 out of 595 applicants were admitted, a 3.87% transfer rate, well below the first-year acceptance rate.
4. What are my chances of getting off Williams’s waitlist?
It varies considerably from year to year. For the Class of 2029, Williams admitted just 25 students from 850 confirmed waitlist spots for a 2.94% rate. In prior years, that number has been as high as 13.17%, so outcomes depend heavily on how many admitted students choose to enroll.
5. Why is Williams’s acceptance rate so low?
Applications have nearly doubled over the past decade while the number of admitted students has stayed roughly the same, meaning more qualified applicants are competing for the same number of spots. The Class of 2030 set a new application record at 16,557.
Takeaways
- Williams’s acceptance rate has fallen sharply, from 15.12% for the Class of 2024 to a new record low of 7.48% for the Class of 2030, driven by an all-time high of 16,557 applications.
- ED offers a significant statistical advantage. For the Class of 2030, the ED rate was 25.22% compared to just 6.32% for RD, though early applicants also tend to be among the strongest candidates.
- The surge in applications has been the biggest driver of declining odds. Williams received fewer than 9,000 applications for the Class of 2024; by the Class of 2030, that number had grown to over 16,500.
- Transfer and waitlist admissions are equally unpredictable. The transfer rate rose slightly to 3.87% for Fall 2025, while waitlist admits collapsed to just 25 students for the Class of 2029, a 2.94% rate that underscores how enrollment-dependent these outcomes are.
- With odds this tight, working with a college admissions expert can make a real difference. The right guidance helps you build a stronger application, tell a more compelling story, and put your best foot forward when it matters most.