Stanford University Diversity Statistics: An In-Depth Overview
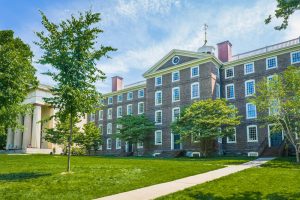
Stanford University, established in 1885 by Leland and Jane Stanford in Stanford, California, is a private research university acclaimed for its academic excellence, financial endowment, and close ties to Silicon Valley, as well as its engagement with inclusivity, reflected in the Stanford University diversity statistics.
Stanford has seven schools, a large 8,180-acre campus, and is known for its entrepreneurial spirit and ties to the tech industry. The university has a significant endowment, facilitating extensive research opportunities. It’s also a member of the NCAA Division I Pac-12 Conference, known for its successful athletic programs.
How many students attend Stanford University?

Stanford University hosts over 16,000 students in various degree programs, including undergraduate, master’s, professional, and doctoral studies.
The university’s undergraduate population is around 7,800, with a specific count of 8,049 undergraduates recorded in fall 2022. This diverse student body is engaged in a wide range of academic disciplines across the university’s schools and departments.
Stanford University Undergraduate Population
As of the academic year 2022-2023, Stanford University had an undergraduate student population of approximately 7,800.
This figure is indicative of the university’s commitment to promoting a diverse and dynamic academic community, offering a wide range of study areas and extracurricular activities to its undergraduate students.
Stanford University Graduate Population

Stanford University’s graduate student community numbers around 9,565. The university offers a diverse array of graduate-level programs, encompassing doctoral, master’s, and professional degrees.
These programs are distributed across its seven distinct schools: Business, Doerr School of Sustainability, Education, Engineering, Humanities and Sciences, Law, and Medicine, each providing specialized education and research opportunities.
Stanford University International Student Population
Stanford University’s student body includes 7,761 undergraduates and 9,565 graduate students. International students comprise a significant portion of this population, with 679 undergraduate students from abroad, representing about 8% of the total undergraduate cohort.
The graduate student body has a higher proportion of international students, approximately 30%, underlining the university’s global appeal and diverse academic community.
Stanford University Gender Distribution
At Stanford University, the undergraduate student body is almost evenly split by gender, with females representing about 51% and males about 49%.
In the graduate student population, the gender ratio skews slightly towards males, with men constituting around 56% and women around 44% of full-time students.
Stanford University Age Distribution
The age distribution at Stanford University highlights a predominantly young student body, with the majority aged between 18 and 29 years, indicative of a typical undergraduate and graduate population as reported by its diversity statistics.

|
Age Range |
No. of Students |
|
Under 18 |
12 |
| 18-19 |
2,275 |
|
20-21 |
3,414 |
| 22-24 |
4,237 |
|
25-29 |
5,246 |
| Over 65 |
29 |
This youthful majority contributes to a vibrant campus life, full of energy and traditional college activities. The presence of students outside this age range, though small, adds to the diversity of the student body of Stanford University, introducing a range of perspectives and experiences and boosting its statistics as well.
This mix of ages enriches the university’s social and academic environment, offering a balance between youthful enthusiasm and mature, academically focused pursuits.
Graduate Students Age Distribution
The age distribution among graduate students at Stanford University can be outlined as follows:

|
Age |
No. of Students |
|
Under 25 |
2,802 |
| 25-29 |
5,246 |
|
30-34 |
1,423 |
| 35-39 |
1,008 |
|
40-49 |
1,057 |
| 50 and over |
1,029 |
The age distribution of graduate students at Stanford University shows a diverse academic community, with the majority aged between 25-29, indicating many continue their studies soon after undergraduate programs.
The presence of students from under 25 to over 50 suggests the university attracts a blend of recent graduates, mid-career professionals, and older individuals. This diversity enhances the learning environment and statistics, combining fresh academic perspectives with seasoned professional insights in Stanford University.
Socially, it fosters a mature, career-focused campus culture, offering opportunities for mentorship and professional networking. This age range reflects Stanford’s appeal to students at various stages of their academic and professional journeys.
Stanford University Diversity Statistics and Racial/Ethnic Demographics
The ethnic diversity of Stanford University’s undergraduate population, encompassing a wide range of groups like Asian, Black or African American, Hispanic or Latino, White, and international students, creates a richly diverse campus as reflected in its diversity statistics.

|
Race/Ethnicity |
Percentage |
|
American Indian or Alaska Native |
1% |
| Asian |
27% |
|
Black or African American |
8% |
| Hispanic or Latino* |
18% |
|
International |
12% |
| Native Hawaiian or other Pacific Islander |
<1% |
|
White |
244% |
| Two or more races |
10% |
|
Unknown |
<1% |
This diversity enhances the learning environment of Stanford University by introducing varied cultural perspectives and experiences, promoting inclusivity, boosting its statistics, and broadening academic discussions. This also contributes to a vibrant campus life with numerous cultural events and activities, promoting greater understanding and exchange among different ethnic groups. This diversity prepares students for a globalized world, developing cultural competence crucial for professional and personal growth.
Stanford University Racial/Ethnic Diversity Among Faculty
The data on faculty race and ethnicity at Stanford University shows a significant predominance of White and Asian faculty members, comprising 42.27% and 17.76% respectively.

|
Race/Ethnicity |
No. of Faculty |
Percentage |
|
White |
6,545 | 42.27% |
| Asian | 2,750 |
17.76% |
|
Black or African American |
467 | 3.02% |
| Multi-Ethnic | 279 |
1.80% |
|
Native Hawaiian or Pacific Islander |
47 |
0.30% |
In contrast, there is notable underrepresentation of Black or African American, Multi-Ethnic, and Native Hawaiian or Pacific Islander faculty, with percentages ranging from 0.30% to 3.02%.
This data suggests a need for increased efforts in diversifying the faculty to ensure a broader range of perspectives, experiences, and inclusivity within the university’s academic community. It highlights the importance of promoting diversity and equity in higher education institutions.
Stanford University Geographic Diversity
Stanford University boasts a geographically diverse student body, representing all 50 U.S. states and over 70 countries worldwide.
While 36% of students hail from California, the remaining 50% come from across the U.S., fostering a truly nationwide presence. 14% of students are international, enhancing the university’s global perspective.
Stanford’s commitment to financial aid for international students varies, with the necessity of obtaining a Social Security Number or an Individual Taxpayer Identification Number for aid eligibility.
The university’s geographic diversity is notably high, ranking 71st out of 2,183 institutions, with 60.08% of students from out of state and 12.26% from overseas, as reflected in its diversity statistics.
Stanford University Financial Diversity
Stanford University’s financial aid program is based on need, evaluating your family’s financial circumstances to determine aid eligibility. It bridges the gap between the total college costs and your ability to pay.
The university uses a standardized method to assess your expected contribution, and if you can’t meet the student budget with that amount, they provide scholarships, grants, or other resources to assist you.
The average scholarship/grant for the Class of 2026 is $68,308, comprising funds from Stanford and various sources. The table provided illustrates the average combined scholarship and grant amounts categorized by income ranges for dependent students whose families reside in the United States:
|
Total (Gross) Family Income |
Average Scholarship and Grant | Average Net Cost |
% of applicants who qualify for scholarship aid from Stanford |
|
Less than $ 75,000 |
86,045 | 4,194 | 99% |
| 75,000 – 100,000 | 78,402 | 6,595 |
98% |
|
100,000 – 125,000 |
70,596 | 13,764 | 94% |
| 125,000 – 150,000 | 62,436 | 20,469 |
96% |
|
150,000 – 175,000 |
53,447 | 30,643 | 98% |
| 175,000 – 200,000 | 49,988 | 33,046 |
95% |
|
200,000 – 225,000 |
39,995 | 41,706 | 95% |
| 225,000 – 250,000 | 33,800 | 50,060 |
82% |
|
250,000 – 275,000* |
27,846 | 56,204 | 78% |
| 275,000 – 300,000* | 28,180 | 55,832 |
63% |
|
300,000 – 325,000* |
22,180 | 61,582 | 57% |
| 325,000 – 350,000* | 24,376 | 59,567 |
52% |
|
350,000 – 375,000* |
24,253 | 59,759 | 30% |
| 375,000 – 400,000* | 16,559 | 68,463 |
33% |
|
Greater than $400,000* |
17,872 | 65,498 |
11% |
*The majority of eligible individuals have two or more children attending college.
Eligibility considers family income, size, members in college, and assets, ensuring assistance for those in need. The Average Net Cost covers expenses not covered by gift funds, including tuition, fees, room, board, books, personal expenses, and travel.
How diverse and inclusive is Stanford University?

Stanford University is deeply committed to diversity, equity, and inclusion, as shown in its effort to boost its diversity statistics. The Diversity and Access Office plays a pivotal role in promoting these values across the university community. Stanford’s student body is exceptionally diverse, representing all 50 U.S. states and 76 countries.
The faculty also reflects high racial and ethnic diversity. Importantly, Stanford ensures that admitted undergraduates who qualify for financial assistance receive full demonstrated need without loans.
Additional support includes need-based self-help aid, cultural centers, mentorship programs, and student organizations, all contributing to a richly inclusive and supportive learning environment.
Is diversity important at Stanford?
Stanford University has implemented several initiatives to promote diversity and inclusion, including the following:
The IDEAL Initiative
Stanford University has introduced the “IDEAL” initiative, which stands for Inclusion, Diversity, Equity, and Access in a Learning Environment. This program is focused on enhancing diversity, fairness, accessibility, and inclusiveness in its academic setting.
The main goal of the initiative is to make sure that a wide range of perspectives, experiences, ways of thinking, and personal identities are included in every part of Stanford’s educational and research activities. It also aims to ensure that everyone in the Stanford community has equal opportunities and can equally benefit from what the university has to offer.
Diversity and Access Office
Stanford University has established the Diversity and Access Office, which plays a key role in supporting the university’s dedication to diversity, and equal opportunities, and ensuring that everyone, including students, staff, faculty, and visitors, can access university facilities and programs.
This office is in charge of managing policies that prevent discrimination and providing various resources related to this. Students can use this office to express any issues or complaints they have regarding discrimination they may face at the university.
Financial Aid and Scholarships
Stanford University offers substantial financial help to its students. It covers the entire financial need, without requiring loans, for every undergraduate student who gets admitted and needs financial aid.
Every year, the university distributes more than $200 million in scholarships and grants to assist students financially. This ensures that students can afford their education regardless of their financial background.
Cultural Resources and Support
Stanford University provides a variety of cultural resources, mentorship opportunities, and student groups designed to help students from different backgrounds. These resources are aimed at enhancing the educational experience for undergraduates, offering support and enrichment that go beyond traditional classroom learning.
This approach helps to strengthen the overall impact of the education Stanford provides, taking into account the diverse needs and experiences of its student body.
Clubs at Stanford University that promote diversity

Stanford University hosts seven dedicated centers that concentrate on issues of equity, community building, and leadership. These centers offer students a supportive environment where they can confidently express and explore their own identities.
At the same time, these centers enable students to learn about the diverse experiences of others. These seven centers, along with additional offices and centers at Stanford, are specifically designed to foster a sense of belonging and understanding among students from various backgrounds, promoting leadership and community engagement.
Asian American Activities Center (A3C)
The Asian American Activities Center (A3C) at Stanford University falls under the management of the Vice Provost of Student Affairs. It serves as a crucial hub for Asian and Asian American students, faculty, staff, and alumni. The center is dedicated to meeting the needs of the Stanford community by offering a range of resources. It also plays a significant role in promoting multicultural education and in cultivating leadership skills among students, especially in navigating diverse settings.
The A3C is well-equipped with various facilities to support its functions. These include a comfortable lounge, a conference room for meetings and discussions, a kitchen, and a library with relevant resources.
In terms of programs, the A3C is proactive in offering several initiatives. These include the Asian American Interactive Mentoring (AIM) Program, which focuses on personal and professional development, the Asian American Studies Program which provides academic insights into Asian American experiences, and the Asian American Graduation, a special event celebrating the achievements of Asian American students.
Furthermore, the A3C places a strong emphasis on community building. It strives to create a supportive and inclusive community for Asian and Asian American individuals at Stanford. This effort is aimed at enhancing diversity statistics understanding and awareness of Asian and Asian American cultures and experiences, thereby enriching Stanford University’s cultural diversity.
Black Community Services Center (BCSC)
The Black Community Services Center (BCSC) at Stanford University is a key component of the Centers for Equity, Community, and Leadership (ECL) and operates under the umbrella of Student Affairs. Known affectionately as “The Black House,” the center was founded as a direct response to student activism. It is dedicated to nurturing students in a comprehensive manner, guided by five core pillars: academic support, cultural programming, leadership development, community engagement, and wellness. The BCSC welcomes visitors from Monday to Saturday, from 10 am to 8 pm.
The center is equipped with facilities designed for hosting various events. These include a lounge for casual gatherings, a conference room for formal meetings, and a kitchen for event catering.
The BCSC boasts a team of professional staff who are deeply committed to the center’s mission. Their primary focus is to support the students and ensure the center’s objectives are met.
A significant focus of the BCSC is to cultivate a strong community spirit and provide support specifically tailored to the Black student population at Stanford University. This includes various initiatives and programs aimed at encouraging a sense of belonging and community.
El Centro Chicano y Latino
El Centro Chicano y Latino at Stanford University is a dynamic and welcoming space for students, playing a crucial role in their academic, personal, social, and cultural support. It acts as a central gathering place for the Chicano, Latino, and Hispanic communities on campus. The center offers a variety of resources and programs designed to create a strong sense of belonging and to promote the overall growth and development of its students.
Under the leadership of the Associate Dean of Students and Director, Elvira Prieto, El Centro Chicano y Latino is committed to fostering community. It strives to provide a nurturing and supportive environment specifically tailored for students from these cultural backgrounds. This commitment is evident in the center’s various initiatives and activities, all geared towards enhancing the student experience.
For those seeking more comprehensive information about El Centro Chicano y Latino, including the full range of its programs and resources, the center’s website is a valuable resource. The website offers detailed insights into the center’s activities, goals, and how it serves the student community at Stanford University.

First Generation and/or Low-Income Student Success Center (FLISSC)
This center at Stanford is specifically designed to assist first-generation and low-income students. It offers various resources and programs aimed at supporting their academic journey, ensuring their success, and addressing the unique challenges they may face due to their financial or familial backgrounds.
Diversity and First-Gen Office
The Diversity and First-Gen Office, often referred to as the DGen Office, is a dedicated support hub at Stanford University. Its primary mission is to provide assistance and resources to underrepresented students, including first-generation, low-income, and others who may need support.
The vision of the DGen Office is to promote equity, empowerment, and genuine engagement among all Stanford students, creating an inclusive and welcoming campus environment and better results in diversity statistics. You can find the DGen Office conveniently located in Old Union Suite 206, making it easily accessible to students seeking assistance.
The DGen Office includes the First Generation and/or Low-Income Student Success Center (FLI). This center offers specialized support to various student groups, including first-generation, low-income, transfer, and current/former foster youth students at Stanford. The FLI Center was initially a part of the DGen Office and became an independent office in 2018, further expanding its support for these student populations.
Collaboration is a key element of the DGen Office’s approach. The office actively works with other student resource centers, like the Native American Cultural Center, to make sure that the diverse needs of underrepresented students at Stanford are met. This collaborative effort reinforces Stanford University’s commitment to boosting its diversity statistics and supporting all students in their academic life.
The Markaz: Resource Center
The Markaz Resource Center, part of the Centers for Equity, Community, and Leadership (ECL) at Stanford University, offers a welcoming environment along with various resources and programs. It aims to engage, educate, and empower the wider Stanford community. The center is specifically focused on supporting students who have an interest in or identify with Muslim experiences, both at Stanford and globally.
The Markaz Resource Center provides a wide array of resources and organizes numerous programs. These include events that are designed and led by Stanford students, facilitating discussions and explorations of diverse experiences, questions, and ideas that resonate with them. The center is also a key gathering place for many students and student groups connected to the Muslim community, whether through academic interests, cultural identity, or other affiliations.
Native American Cultural Center (NACC)
The Native American Cultural Center (NACC) at Stanford University serves as a crucial resource for Indigenous-identifying students, who represent over 50 Native nations and islands. The center’s primary goal is to create a welcoming and supportive space for these students, as well as others on campus and the broader community.
A key part of the NACC’s work involves collaborating with Stanford’s Office of Undergraduate Admission. This partnership aims to assist and guide Indigenous students and their families throughout the college application process. Throughout the academic year, the NACC organizes and supports various events, contributing to a vibrant campus life.
The center is managed by a team of committed professionals, including Denni Dianne Woodward, who plays a significant role in the center’s operations and student support services.
Women’s Community Center (WCC)
The Women’s Community Center (WCC) at Stanford University, operating under the Vice Provost of Student Affairs, is committed to promoting personal growth and involvement among Stanford students on topics like gender, equity, and identity. The center is a warm and welcoming space open to all students, regardless of their gender identity, offering them a platform to explore and engage with gender-related and equity issues.
At the WCC, students have access to a range of resources and activities. These include educational workshops, speaker events featuring experts and influencers, and various activities aimed at building a supportive community. The center is run by a team of dedicated professionals who are committed to the center’s mission and student support.

Queer Student Resources (QSR)
Queer Student Resources (QSR) at Stanford University is a dedicated center that caters to students of all gender identities and sexual orientations. It focuses on providing resources, support, and various programs to facilitate students’ understanding and involvement in matters related to gender and sexuality. One of the notable offerings of QSR is an informal guide designed to assist trans and questioning students at Stanford, providing them with relevant information and resources.
The center is operated by a team of committed professionals and also provides opportunities for students to participate as staff members, further enhancing their involvement and experience at the university. QSR maintains a close affiliation with the Women’s Community Center, which is known for its innovative programs in scholarship, leadership, and activism, and is open to individuals of all genders and identities.
Bechtel International Center
The Bechtel International Center, operating under the Vice Provost of Student Affairs, is a valuable department at Stanford University dedicated to serving both the international community at Stanford and U.S. students interested in scholarships for study and research abroad. The center is conveniently located on campus at 584 Capistrano Way, Stanford, CA 94305.
The Bechtel International Center provides a wide range of resources and services to cater to the needs of its diverse community. These include:
Immigration Services: The center offers vital assistance with various immigration-related matters. This includes helping students with tasks like extending their visas, making change requests, and providing guidance on related issues.
Scholarships and Grants: One of the significant roles of the Bechtel International Center is to assist students in finding and applying for scholarships and grants that support study and research opportunities abroad.
Cultural Programs: Throughout the academic year, the center takes an active role in hosting and co-sponsoring events. These include cultural programs that celebrate the rich and diverse backgrounds of international students, contributing to a vibrant campus life.
Language Support: The Bechtel International Center offers valuable language support resources. These resources help students enhance their language skills, promoting better communication with their international peers and enriching their overall experience.
Office for Religious Life
The Office for Religious Life is a key department in universities that caters to the spiritual and religious needs of its students, staff, and faculty. This office is integral in various institutions, including Stanford University, Princeton University, Emory University, University of Southern California, and Columbia University. Here are some of the essential functions and goals of these offices:
The main objective of these offices is to foster and support the spiritual and religious aspects of life within the university community. This includes guiding and enriching the spiritual experiences of members of the university.
They provide a variety of services including private counseling for personal matters, support during times of grief or distress, and help in organizing religious ceremonies and events. Recognizing and supporting the diverse religious and philosophical beliefs within the university is a key aim. These offices work towards creating a welcoming and inclusive environment for all beliefs and practices.
The office organizes various activities that help explore and understand spirituality. This includes workshops, retreats, and other events that delve into the spiritual side of life and learning. These offices are equipped with resources like religious texts, sacred music, advisors for religious life, and information regarding facility timings and current news.
These universities have established the Office for Religious Life to ensure that the spiritual needs of their diverse communities are met and supported, highlighting their commitment to fostering an inclusive academic environment.

Office for Military-Affiliated Communities (OMAC)
The Office for Military-Affiliated Communities (OMAC) at Stanford University, functioning under the Vice Provost of Student Affairs, plays an important role in providing support and advocacy for student veterans and ROTC cadets. The aim of OMAC is to facilitate connections between students and various resources available on and off campus and to encourage engagement within the Stanford community.
OMAC is instrumental in offering a range of resources that cater to the specific needs of student veterans and their families, both within the university setting and in the wider community.
The office is led by a Program Manager, Shane Hale, who is responsible for managing the department and ensuring that the needs of military-affiliated students are met efficiently.
OMAC also plays a big role in maintaining the Stanford Military Service Network. This network comprises Stanford affiliates with military backgrounds and focuses on mutual support and contributing positively to the broader Stanford community.
Career Development Center
The Career Development Center (CDC) at Stanford University, operating under the Vice Provost of Student Affairs, is a valuable resource that assists students in exploring career opportunities, conducting job or internship searches, and receiving guidance and support as they plan for their future careers.
The CDC offers a diverse range of services and resources to cater to the needs of Stanford students:
The center provides counseling services to aid students in making well-informed decisions about their career paths. These sessions help students plan for life after their time at Stanford.
The CDC conducts workshops and presentations covering various career-related topics. These sessions equip students with the skills and knowledge necessary to excel in their chosen fields.
The CDC helps organize on-campus recruiting events. These events enable students to connect with potential employers, learn about job and internship opportunities, and explore different career paths.
The center maintains extensive databases of job and internship listings, providing students with access to a wide range of opportunities across various industries and sectors.
The CDC offers reference file services, access to library resources, and opportunities for alumni networking. These resources help students make informed decisions about their careers and plan for their future success.
The Career Development Center’s physical location is at 563 Salvatierra Walk, Stanford, CA 94305, making it easily accessible for students on campus.
Haas Center for Public Service
The Haas Center for Public Service at Stanford University is a central hub that connects academic learning with community and public service. Its primary goal is to strengthen communities and instill a sense of social and civic responsibility in students. The center offers a diverse range of service opportunities and is a year-round resource for students interested in engaging in public service activities during their time at Stanford.
Within the Haas Center, you’ll find a variety of student organizations and projects, each with its unique focus on public service. These include the Stanford Volunteer Network, Stanford in Government, and the Ravenswood-Stanford Tutoring Program. These initiatives provide students with the chance to actively participate in service and contribute to meaningful causes.
The core mission of the Haas Center for Public Service is to cultivate informed, engaged, and compassionate citizens who actively work toward creating a fairer and more humane world. The center’s physical location is at 562 Salvatierra Walk, Stanford, CA 94305, making it easily accessible for students seeking guidance and involvement.

Hillel at Stanford
Hillel at Stanford serves as a welcoming home for both undergraduate and graduate students, providing a vibrant space to share the richness and beauty of Jewish life with the entire university community. One of its primary goals is to establish connections with every student and build relationships with the majority of Jewish undergraduates at Stanford.
Hillel offers a diverse range of resources and programs designed to enrich the Jewish experience on campus:
Through initiatives like the Jewish Learning Fellowship, students have the opportunity to engage in Jewish text study, fostering a deeper understanding of their heritage.
The Taube Center for Jewish Studies offers courses that allow students to delve into various aspects of Jewish culture, history, and identity.
Throughout the year, Hillel organizes events encompassing social gatherings, cultural celebrations, educational seminars, and religious observances, contributing to a vibrant Jewish community.
The Harold and Libby Ziff Center for Jewish Life serves as the central gathering place for Stanford’s Jewish Community group, Hillel. This center is located at 565 Mayfield Avenue, Stanford, CA 94305. It hosts significant events such as a communal first-night seder during Passover and provides opportunities for travel during spring break.
In collaboration with the Brief Therapy Center, Hillel also offers a valuable resource for mental health support. Short-term teletherapy sessions are available at no cost to Hillel-affiliated students, ensuring that students have access to the support they need.
The Office of International Affairs
The Office of International Affairs at Stanford University helps in advancing international research and forge new global partnerships. This office falls under the oversight of the Vice Provost and Dean of Research and is committed to fostering international collaborations.
The Office of International Affairs works in close collaboration with various departments and centers on campus, with a particular focus on providing valuable resources and support to international students and scholars. The Bechtel International Center, dedicated to serving international students and scholars, is a key partner in these efforts.
The International Affairs website is a valuable resource that offers information on various topics, including visas, travel, and other essential resources for international students and scholars. It serves as a central hub for accessing important information related to international affairs.
The office actively supports the study of international relations through the Political Science department. This department offers a range of courses covering global and regional political issues, international trade, finance, environmental concerns, and the functioning of international institutions and international law.
Is Stanford University The Right Fit For You?

Deciding if Stanford University is the right fit for you involves considering several factors:
Academic Programs
Check if Stanford has top-notch programs in your field of study. It’s renowned for its high-quality courses in engineering, computer science, and business, among others. Make sure the university’s strengths match your educational ambitions and the specific area you want to focus on.
Campus Culture
Think about the overall environment and community at Stanford. The university is recognized for fostering teamwork, encouraging innovative thinking, and having a wide range of students from different backgrounds. It’s important to see if this type of environment suits your personal style and how you prefer to learn.
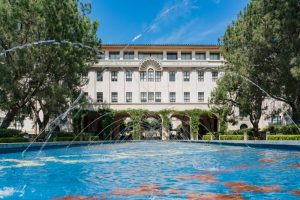
Location and Environment
Consider the setting of Stanford in the Bay Area of California. This region is known for its pleasant climate, close connection to Silicon Valley, and abundant outdoor activities. These features are appealing to a lot of people. The Bay Area has a vibrant cultural scene, with a diverse mix of artistic, technological, and entrepreneurial influences. This unique blend creates a dynamic and innovative atmosphere which is important to factor into your decision.
Opportunities Outside of Academics
Look into the various opportunities Stanford offers beyond its academic curriculum. This includes a wide range of extracurricular activities, research projects, and internship possibilities. Stanford’s strong ties with various industries and its extensive network of student clubs and organizations play a crucial role.
These opportunities enhance your educational experience and prepare you for your future career. The university’s location in a culturally rich and diverse area adds to these opportunities. The surrounding community offers a variety of cultural experiences, events, and potential networking connections, all contributing to a well-rounded educational environment.
Financial Considerations
It’s crucial to thoroughly assess the financial obligations involved in attending Stanford. Although the university is known for providing substantial financial aid, it’s essential to carefully evaluate the overall costs against your personal financial circumstances.
This includes tuition, living expenses, and any additional fees. Understanding and planning for these financial requirements early on will help you make an informed decision about your education and ensure you’re prepared for the financial commitment.
Size and Resources
Stanford University is known for its large size and the abundance of resources it offers. This scale brings a variety of opportunities, from diverse course offerings to extensive research facilities and support services.
However, it’s important to recognize that the vastness of the university might be daunting for some individuals. The experience of navigating a large campus with a wide array of programs and activities can be very different from that of a smaller institution.
Consider how you might fit into this environment and whether a large university setting aligns with your personal and educational preferences.
Alumni Network
Reflect on the strength and influence of Stanford’s alumni network. This extensive network can be a valuable asset for your career, offering a wide range of opportunities and connections in various industries.
Being part of such a network can open doors to job opportunities, mentorship, and professional collaborations. The relationships and support you can gain from this community are significant factors to consider when thinking about the long-term benefits of your education at Stanford.

Personal Goals and Values
Take time to think deeply about your own goals, principles, and what you expect from your university journey. Stanford University places a strong focus on promoting innovation, developing leadership skills, and creating a positive social impact.
If these aspects resonate with you and align with your personal ambitions, Stanford could be a good fit. It’s important to choose a university that not only offers excellent academic programs but also aligns with your individual values and aspirations, shaping a fulfilling and enriching college experience.
Ultimately, the decision should be based on a combination of practical considerations and personal fit. If possible, visiting the campus, talking to current students or alumni, and researching extensively can provide valuable insights.
Final Thoughts
Stanford University paints a picture of an institution deeply committed to fostering an inclusive and multifaceted academic environment. As we have explored in this blog, Stanford’s student body, faculty, and staff come from a diverse backgrounds, cultures, and perspectives, contributing to memorable experiences and ideas on campus.
Stanford University’s efforts in promoting diversity statistics reflect a deeper commitment to creating a learning space where every individual feels valued, heard, and included. This commitment is evident in their policies, curriculum, and the vibrant campus life that celebrates differences while uniting in academic and social endeavors.
As potential students, alumni, or academics, understanding and appreciating these diversity statistics is important. These statistics represent the ongoing journey toward encouraging diversity in the academic world, even outside of Stanford University. Stanford demonstrates how diversity can enrich the educational experience, drive innovation, and prepare students for a globalized world.
These Stanford University diversity statistics are a starting point for conversations on diversity and inclusion. They challenge us to think critically about our roles in these dynamic spaces and encourage us to contribute positively to the ever-evolving university life. Stanford University, through its commitment to diversity, invites us to be part of this exciting and necessary dialogue, shaping not just the future of education but the future of our interconnected world.